Demystifying SharePoint Performance Management Part 8 – More on SQL and SQLIO
Well here we are at part 8 of my series on making SharePoint performance management that little bit easier to understand. What is interesting about this series is its timing. If by some minute chance that the marketing tsunami has passed you by at the time I write this, SharePoint 2013 public beta was released. Much is being made about its stated requirement of 24GB of RAM for a “Single server with a built-in database or single server that uses SQL Server”. While the reality is that requirements depends on what components that you are working with, this series of articles should be just as useful in relation to SharePoint 2013 as for any other version.
Now, if you have been following events thus far, we have been spending some time examining disk performance, as that is a very common area where a sub optimal configuration can result in a poor experience for users. In part 6, we looked at the relationship between the performance metrics of disk latency, IOPS and MBPS. We also touched on the IO characteristics (nerd speak for the manner in which something reads and writes to disk) of SQL Server and some SharePoint components. In the last post, we examined the windows performance counters that one would use to quickly monitor latency and IOPS in particular. We then finished off by taking a toe dip into the coolness of the SQLIO utility, that is a great tool for stress testing your storage infrastructure by pulverising it with different IO read and write patterns.
In this post, we will spend a bit of time taking SQLIO to the next step and I will show you how you can run a comprehensive disk infrastructure stress test. Luckily for the both of us, others have done the hard work for us and we can reap the benefits of their expertise and insights. First up however, I would like to kick things off by spending a little time showing you the relationship between SQLIO results and performance monitor counters. This helps to reinforce what the reported numbers mean.
Performance Monitor and SQLIO
In the previous post when we used Windows Performance Monitor, we plotted IOPS and Latency by watching the counters as they occurred in real-time. While this is nice for a quick analysis, nothing is actually stored for later analysis. Fortunately, performance monitor has the capability to run a trace and collect a much larger data set for a more detailed analysis later. So first up, lets use performance monitor to collect disk performance data while we run a SQLIO stress test. After the test has been run, we will then review the trace data and validate it against the results that SQLIO reports.
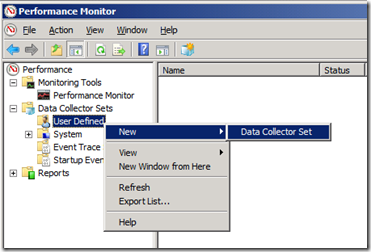
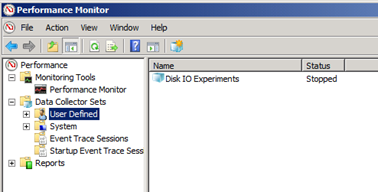
So go ahead and start up performance monitor (and consult part 7 of this series if you are unsure of how to do this). Looking at the top left of the performance manager, you should see several options listed under “Performance”. Click on “Data Collector Sets” and look for a sub menu called “User Defined”. Now right click on “User Defined” and choose “New –> Data Collector Set” as shown below:
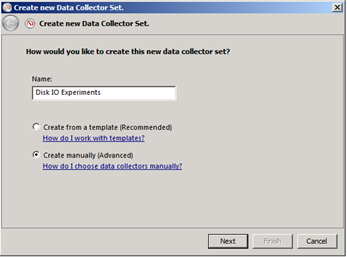
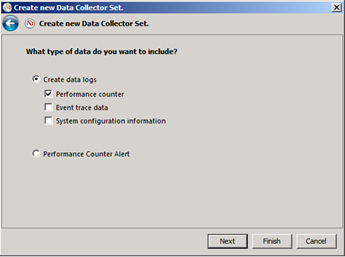
This will start a wizard that will ask us to define what performance counters we are interested in and how often to sample performance. I have pasted screenshots of the sequence below (click to enlarge any particular one). First up we need to give a name to this collection of counters and as you can see below, I called mine “Disk IO Experiments”. Once we have given it a name, we have to choose the type of performance data we want to collect. Tick the “Performance counter” button and ensure the others are left unticked.
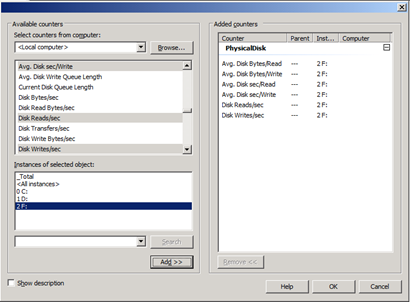
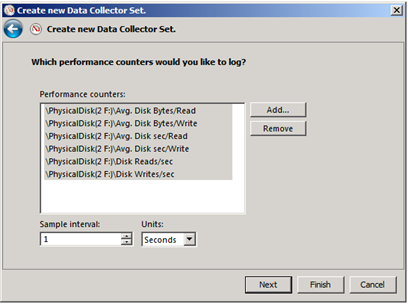
Next we need to pick what specific counters we need. We will use the same counters that we used in part 7, with the addition of two additional ones. To remind you of part 7, the counters we looked at were:
- Avg. Disk sec/Read – (measures latency by looking at how long in seconds, a read of data from the disk took)
- Avg. Disk sec/Write – (measures latency by looking at how long in seconds, a write of data to the disk took)
- Disk Reads/sec – (measures IOPS by looking at the rate of read operations on the disk per second)
- Disk Writes/sec – (measures IOPS by looking at the rate of write operations on the disk per second)
In addition to these counters, we will also add two more to the collector set
- Avg. Disk Bytes/Read – (Measures size of each read request by reporting the number of bytes each used)
- Avg. Disk Bytes/Write – (Measures size of each write request by reporting the number of bytes each)
We will use these counters to see if the size of the IO request than SQLIO uses is reported correctly.
Depending on your configuration, choose the PhysicalDisk or LogicalDisk performance object (consult part 7 for the difference between PhysicalDisk and LogicalDisk). You will then find the performance counters I listed above. Before you do anything else, make sure that you pick the right disk or partition from the “Instances of selected object” section. We need to specifically pick the disk or partition that SQLIO is going to stress test. Now you select each of the aforementioned six performance counters and click the “Add” button. Finally, make sure that you pick the sample interval to be 1 second as shown below. This is really important because it makes it easy to compare to SQLIO which reports on a per second basis.
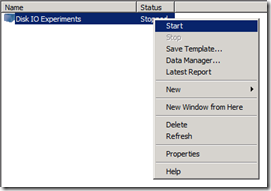
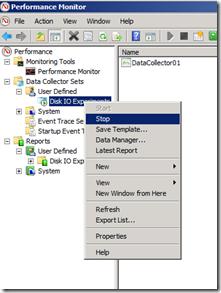
At this point you do not need to configure anything else, so click the “Finish” button, rather than the “next” button, and the collector should now be ready to go. It will not start by default, but since there is no fun in that, let’s collect some data. Right click on your shiny new data collector set and choose “Start”.
Once started, performance monitor is collecting the values of the six counters each and every second. Now let’s run a SQLIO command to give it something to measure. In this example, I am going to run SQLIO with random 8KB writes. But to make it interesting, I will use two threads and simulate 8 outstanding IO requests in the queue. If you recall by grocery check-out metaphor of part 6, this is like having 8 people with full shopping carts waiting in line for a single check-out operator. Since the guy at the back of the line has to wait for the seven people in front of him to be processed, he has to wait longer. So with eight outstanding IO requests, latency should increase as each IO request will be sitting in a queue behind the seven other requests.
By the way, if none of that made sense, then you did not read part 6 and part 7. I urge you to read them before continuing here, because I am assuming prior knowledge of SQLIO and disk latency characteristics and the big trolley theory..
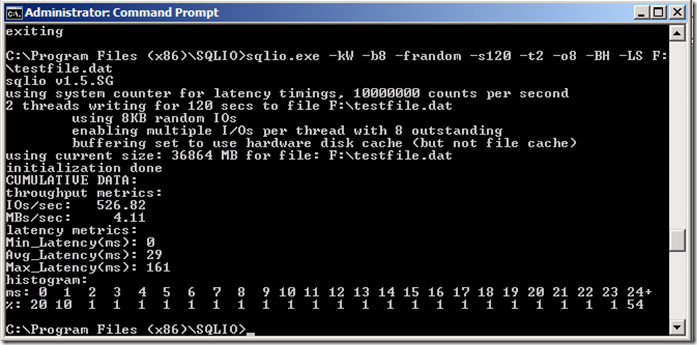
Here is the SQLIO command and below is the result…
SQLIO –kW –b8 –frandom –s120 –t2 –o8 –BH –LS F:\testfile.dat
Now take a note of the results reported. IOPS was 526, MBs/sec was 4.11 and as expected, the average latency was much larger than the SQLIO tests we ran in part 7. In this case, latency was 29 milliseconds.
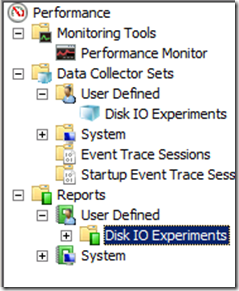
Let’s now compare this to what performance monitor captured. First up, return to Performance Monitor, and stop your data collector set by right clicking on it and choosing “Stop”. Now if you cast your eye to the top left navigation pane, you should see an option called “Reports” listed under “Performance”. Click on “Reports” and look for a sub menu called “User Defined”. Expand “User Defined” and hey presto! Your data collector set should be listed…
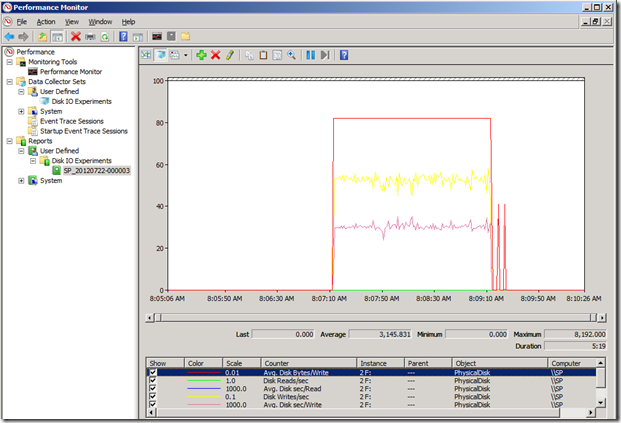
Expand the data collector set and you will find a report for the data you just collected. The naming convention is the server name and the date of the collection. Click on this and you will then see the performance data for that collection in the right pane. At the bottom you can see the six performance counters we chose and just by looking at the graph, you can clearly see when SQLIO started and stopped.
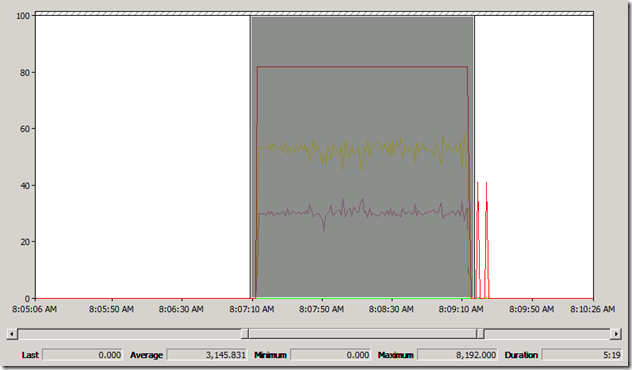
Now we have to do one additional step to make sure that we are comparing apples with apples. Performance monitor will calculate its averages based on the total time displayed. As you can see above, I did not run SQLIO straight away, but the performance counters were collected each second nonetheless. Therefore we have a heap of zero values that will bring the averages down and mislead. Fear not though, it is fairly easy (although not completely obvious) to zoom into the time we are interested in. If you look closely, just below the performance graph, where the time is reported, there is a sliding scale. If you click and drag the left and right boxes, you can highlight a specific time you are interested in. This will be shown in the performance graph too, so using this tool, we can get more specific about the time we are interested in. Then in the toolbar above the graph, you will see a zoom button. Click it and watch the magic…
As you can see below, now we are looking at the performance data for the period when the SQLIO was run. (Now it should be noted that windows performance monitor isn’t particularly granular here. I had to fiddle with the sliding scale a couple of times to accurately set the exact times when SQLIO was started and then stopped.)
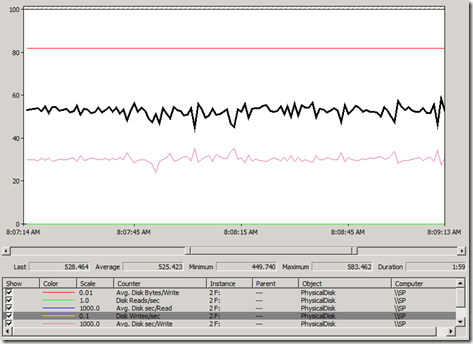
Now let’s look at the results reported by performance monitor. The screenshot above is looking at the number of Disk Writes per second. Let’s zoom into the figures for the time period and example the average result over the sample period. To save you squinting, I have pasted it below and called out the counter in question. Performance monitor has reported average “Disk Writes/Sec” as 525.423. This is entirely consistent with SQLIO’s reported IOPS of 526.
Latency (reported in seconds via the counter Avg. Disk sec/Write) is also fairly consistent with SQLIO. The figure from performance monitor was 0.03 seconds (30 milliseconds). SQLIO reported 29 milliseconds.
What about IO size? Well, that’s what Avg disk bytes/write is for… Let’s take a look shall we? Yup.. 8192 kilobytes, which is exactly the parameters specified.
SQL IO characteristics revisited (and an awesome script)
Now that we understand what SQLIO is telling us via examining windows performance monitor counters, I’d like to return to the topic of SQL IO patterns. Back at the end of part 6, I spent some time talking about SQL and SharePoint IO characteristics. As a quick recap, I mentioned SQL reads and writes to databases via 8KB pages. Now based on me telling you that, you might assume that if you had to open a large document from SharePoint (say 1MB or 1024KB), SQL would make 128 IO requests of 8KB each.
While that would be a reasonable assumption, its also wrong. You see, I also mentioned that SQL Server also has a read-ahead algorithm. This algorithm means that means SQL will try and proactively retrieve data pages that are going to be used in the immediate future. As a result, even though a single page is only 8KB, it is not unusual to see SQL read data from disk in a much wider range if it thinks the next few 8KB pages are likely to be asked for anyway. Now as an aside, if you are running SQL Enterprise edition, the possible read-ahead range is from 1 to 128 pages (other editions of SQL max out at 32 pages). Assuming SQL Enterprise edition, this translates to between 8KB and 1024KB for a single IO operation. Think about this for a second… based on the 1MB document example I used in the previous paragraph, it is technically possible that this could be serviced with a single IO request by an enterprise edition of SQL server.
Okay, so essentially SQL has varying IO characteristics when it comes to reading from and writing to databases. But there is still more to it. This is because there are a myriad of SQL IO operations that we did not even consider in part 6. As an example, we have not spoken about the IO characteristics of how SQL writes to transaction logs (which is sequential as opposed to random IO, and does not use 8k pages at all). Another little known fact with transaction logs is that SQL has to wait for them to be “flushed to stable media” before the data page itself can be flushed to stable media. This is known as Write Ahead Logging and is used for data integrity purposes. What is means though is that if logging has a lot of latency, the rest of SQL server can potentially suffer as well (and if it was not obvious before, yet another good reason why people recommend putting SQL data and log files on different disks).
Now I am not going to delve deep into SQL IO patterns any more than this, because we are now getting into serious nerdy territory. However what I will say is this: by understanding the characteristics of these IO patterns, we have the opportunity to change the parameters we pass to SQLIO and more accurately reflect real-world SQL characteristics in our testing. Luckily for all of us, others have already done the hard work in this area. First up, Bob Duffy created a table that summarises SQL Server IO patterns based on the type of operations being performed. Even better than that… Niels Grove-Rasmussen wrote a completely brilliant post, where not only did he list the IO patterns that SQL is likely to exhibit, he wrote a PowerShell script that then runs 5 minute SQLIO simulations for each and every one of them!
I have not pasted the script here, but you will find it at Niels article. What I will say though is that aside from the obvious 8KB random reads and writes that we have concentrated on thus far, Niels listed several other common SQL IO patterns that his SQLIO script tests:
- 1 KB sequential writes to the log file (small log writes)
- 64 KB sequential writes to the log file (bulk log writes)
- 8 KB random reads to the log file (rollbacks)
- 64 KB sequential writes to the data files (checkpoints, reindex, bulk inserts)
- 64 KB sequential reads to the data files (read-ahead, reindex, checkdb)
- 128 KB sequential reads to the data files (read-ahead, reindex, checkdb)
- 128 KB sequential writes to the data files (bulk inserts, reindex)
- 256 KB sequential reads to the data files (read-ahead, reindex)
- 1024 KB sequential reads to the data files (enterprise edition read-ahead)
- 1 MB sequential reads to the data files (backups)
The script actually handles more combinations than those listed above because it also tests for differing number of threads (-t ) and outstanding requests (-o ). All in all, over 570 combinations of IO patterns are tested. Be warned here… given that each test takes 5 minutes to run by default, with a 60 second wait time in between each test, be prepared to give this script at least 2 days to let it run its course!
The script itself is dead simple to run. Just open a powershell window, and save Niels script to the SQLIO installation folder. From there, change to that directory and issue the command:
./SQLIO_Batch.ps1
Then come back in 3 days! Seriously though, depending on your requirements, you can modify the parameters of the script to reduce the number of scenarios based on editing the first 7 lines of code which is quite self explanatory
$Drive = @('G', 'H', 'I', 'J')

$IO_Kind = @('W', 'R') # Write before read so that there is something to read.

$Threads = @(2, 4, 8)

#$Threads = @(2, 4, 8, 16, 32, 64)

$Seconds = 10*60 # Five minutes

$Factor = @('random', 'sequential')

$Outstanding = @(1, 2, 4, 8, 16, 32, 64, 128)

$BlockSize = @(1, 8, 64, 128, 256, 1024)
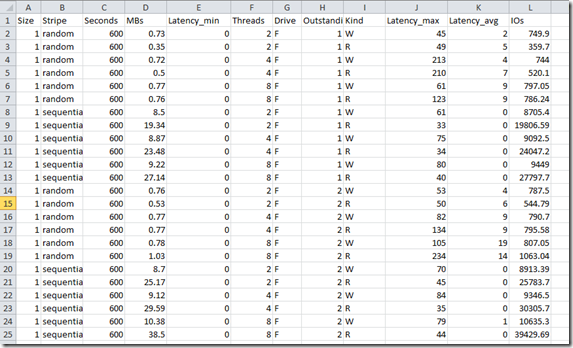
Now if this wasn’t cool enough, Niels also written a second script that parses the output from all of the SQLIO tests. This can produce a CSV file that allows you to perform further analysis in excel. To run this script, we need to know the same of the output file of the first script. By default the filename is SQLIO_Result.<date>.txt. For example:
./SQLIO-Parse.ps1 -ResultFileName ‘SQLIO_Result.2010-12-24.txt’
By default the parse script outputs to the screen, but modifying it to write to CSV file is really easy. All one has to do is comment out the second last line of code and uncomment the last one as shown below:
#$Sqlio | Format-Table -Property Kind,Threads,Seconds,Drive,Stripe,Outstanding,Size,IOs,MBs,Latency_min,Latency_avg,Latency_max -AutoSize
$Sqlio | Export-Csv SQLIO_Parse.csv
Below is an example of the report in Excel. Neat eh?
Conclusion and coming up next…
By now, you should be a SQLIO guru and have a much better idea of the sort of IO patterns that SQL Server has beyond just reading from and writing to databases. We have covered the IO patterns of transaction logs, as well as examined a terrific PowerShell script that not only runs all of the IO scenarios that you need to, but parses the output to produce a CSV file for deeper analysis. In short, you now have the tools you need to run a pretty good disk infrastructure stress test and start some interesting conversations with your storage gurus.
However at this point I feel there some pieces missing to this disk puzzle:
- We have not yet brought the discussion back to lead and lag indicators. So while we know how to hammer disk infrastructure, how can we be more proactive and specify minimum conditions of satisfaction for our disk infrastructure?
- Microsoft treatment of disk performance (and in particular IOPS and latency) in their performance documentation is inconsistent and in my opinion, confuses more than it clarifies. So in the next post, we are going to look at these two issues. In doing so, we are going to leave SQLIO and Performance Monitor behind and examine two other utilities including one that is lesser known, but highly powerful.
Until then, thanks for reading
Paul Culmsee



0 Comments on “Demystifying SharePoint Performance Management Part 8 – More on SQL and SQLIO”