Demystifying SharePoint Performance Management Part 7 – Getting at Latency, IOPS and MBPS
Hi all, and welcome to part 7 of this series on SharePoint performance planning. This is the point of the series where I realise that I have much more to write about than I intended. Last time this happened I never got around to finishing the series (*blush* … a certain tribute to a humble leave form ). Like that series, I now have no idea how many posts I will end up doing, but I will keep soldiering on nonetheless.
Recapping the last two posts of this series in particular, we have been looking at the relationship between the performance measures of Disk latency, Disk I/O per second (IOPS) and Disk Megabytes transferred per second (MBPS). We spent most of part 6 looking at the relationship between these three performance metrics by specifically focusing on how the size of an IO request affects things. If you recall, a couple of key points were made:
- In general, the larger the IO request being made, the more latency there will be, resulting in less IOPS but increased MBPS.
- Latency is significantly affected by whether an IO requests is sequential or random. To demonstrate this, I used a tool called SQLIO to simulate disk IO to generate some performance stats that demonstrated both IOPS and MBPS improved by some 750% when compared to random IO.
We finished the post by examining the way SQL server performs IO requests and what SharePoint components are IOPS heavy. In short, SQL Server uses a range of request sizes for database reads and writes between 8K and 1024KB. The reason for the range (for reads anyhow) is the read-ahead algorithm (gory detail here), in which SQL attempts to proactively retrieve data that are going to be used in the immediate future. A read-ahead may result in a much larger I/O request being made than a single 8KB page, but much better performance because in effect, SQL is pulling more data from each I/O operation.
In this episode (and the next one)…
Our focus in this post and the next one is similar to part 3, in that we are now going to do some real work and some of it will involve the command line. Therefore also like part 3, if you are one of those project manager types who utilise the wussy “I’m business, not technical” excuse, I want you to persist and try this stuff out. Given that I wrote this series with you in mind, put that damn iPad down, get out your laptop and reload this article! You can try all of the steps below out on your PC while you are reading this.
Now for the tech types reading this, on account of my intention to “demystify” SharePoint performance, I will be more verbose that what you guys need. But consider it this way – I am doing you guys a favour because next time your PM or BA’s eyes start to glaze when you start explaining performance and capacity planning to them, you can point them to this series and tell them that there is no excuse.
This article is going to cover two areas. First up let’s look at what we can do with Windows inbuilt Performance Monitor tool in terms of monitoring Latency and IOPS in particular. Next we will look at a popular tool for stress testing disk infrastructure that gives us visibility into MBPS.
The basics: Performance Monitor 101
Just in case you have never done it before, type in PERFMON on any Windows box at the start button or the command line (by the way, I am assuming Windows 7 or Windows 2008 Server here).
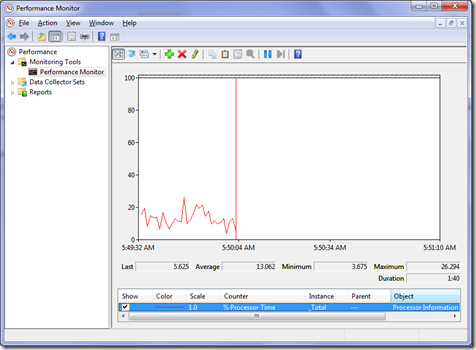
If you did that, then you are looking at the classic tool used to understand how a PC or server is performing. Looking at the top left of the resultant window, you should see several options listed under “Performance”. Click on “Performance Monitor” and watch the magic. Congratulations… you now know how to measure CPU as that is the default performance counter displayed.
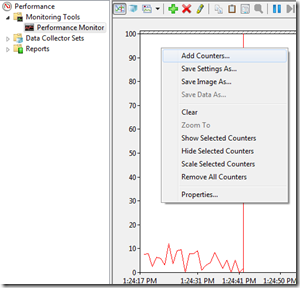
Performance monitor can easily be used to take a look at disk IOPS and latency. Right click on the graph and from the menu choose Add Counters… This will provide you with a long list of “performance objects” (a fancy word for a logical grouping of performance counters)
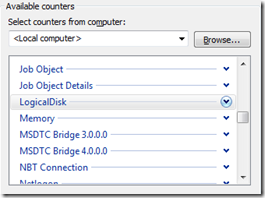
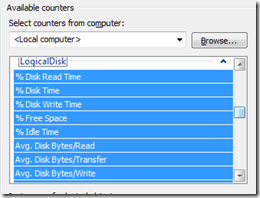
From the list of performance objects, scroll up and find “LogicalDisk”. Move your cursor to the arrow to the right of the LogicalDisk counters and click on it. You should see a list of disk related performance counters appear as shown below.
Note: You could have chosen the performance object called PhysicalDisk instead of LogicalDisk. The difference between them is that physical disk counters only consider each hard drive, not the way it is partitioned. The Logical Disk performance object monitors logical partitions of a disk. As a general role (for non techy types reading this), go with LogicalDisk.
Right then… now currently, all of the possible performance counters for LogicalDisk are currently selected, but for now we are only interested in latency and IOPS, which are represented by four counters:
| Latency: | Avg. Disk sec/Read Avg. Disk sec/Write |
Measures the average time, in seconds, of a read of data to the disk. (Therefore 5ms will be shown as 0.005) Measures the average time, in seconds, of a write of data to the disk MS Technet Note: Numbers also vary across different storage configurations (SAN cache size/utilization can impact this greatly) |
| IOPS | Disk Reads/sec: Disk Writes/sec: |
The rate of read operations on the disk per second. The rate of write operations on the disk per second.MS Technet Note: This number varies based on the size of I/O’s issued. Practical limit of 100-140/sec per disk spindle, however consult with hardware vendor for more accurate estimation. |
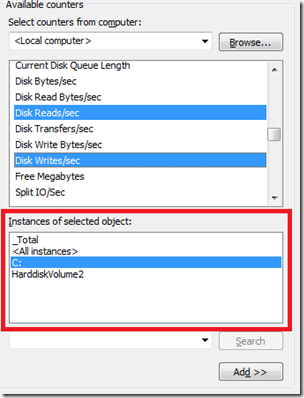
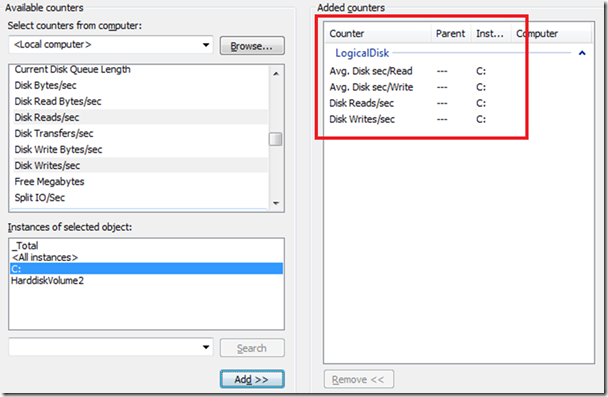
Go ahead and select these four counters (use the Ctrl key and click each one to select more than one counter). Now we have to choose which disk or partition that we want to monitor. Below where you chose the performance counters, you will see a label with the suitably unclear title of “Instances of selected object” (I have highlighted it below). From here, choose the hard drive or partition you are interested in. Finally, click the “Add” button at the very bottom and you should see your selected counters listed in the “Added counters” window.
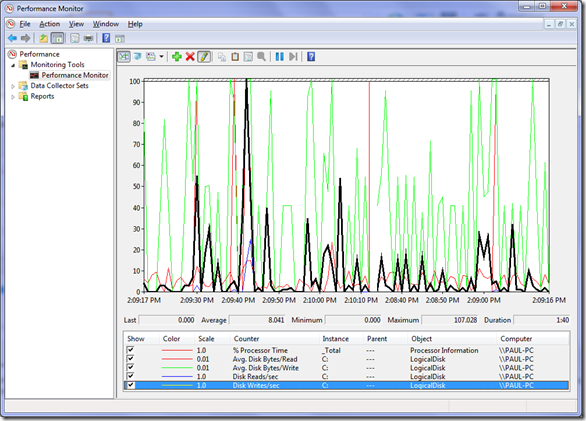
Click the OK button and you should now be seeing these counters doing their thing. Each performance counter you added is listed below the graph showing the performance data collected in real time. The display shows a time period of 100 seconds and is refreshed each second. Also, a neat feature that some people don’t know about it is to click on one of the counters and then hold down Ctrl and type the letter “H”. This is the shortcut key for highlighting the selected counter and the currently selected counter should now be black. Additionally, you should be able to now use the up and down arrow keys to cycle through the counters and highlight each.
At this point, try copying some files or open some applications and watch the effect. You should see a spike in disk related activity reflected in the IOPS and latency counters above. There you go business analysts, you officially have monitored disk performance! Wasn’t so hard was it?
Now that we are monitoring some interesting counters, how about we really give the disk something to chew on! ![]()
Upping the ante with SQLIO
SQLIO is an old tool nowadays, but still highly relevant and extremely useful. Despite being named SQLIO, it actually has very little to do with SQL Server! It was provided by Microsoft to help determine the I/O capacity that a server can handle. SQLIO allows you to test a combination of I/O sizes for read/write operations, both sequentially and randomly. Thus, it is useful for stress testing the disk infrastructure for any IO intensive application. Now be warned… you can absolutely smash your disk infrastructure with this tool, so don’t go running this in production without some sort of official clearance. Furthermore, if you want to use SQLIO to test your SAN, be sure to consider the other servers and applications that might be using it. There is potential to adversely affect them.
You can download SQLIO from Microsoft here. It will run on any recent Windows OS, so you can try it on your own PC (now you know why I told you to put your iPad away earlier). Installing SQLIO is very simple, just run SQLIO.MSI and it will install by default into C:\Program Files(x86)\SQLIO folder.
Note: If you want a great tutorial on installing and using SQLIO, look no further than MCM Brent Ozar’s 2009 article entitled SQLIO Tutorial: How to Test Disk Performance).
SQLIO works by reading from and writing to one or more test files, so the first thing we need to do with SQLIO is to set up a configuration file that specifies the location and size of these test files. The configuration file is called PARAM.TXT and is found in the installation folder. Each line of the configuration file represents a test file, its size and a couple of other parameters. The options on each line of the param.txt file are as follows:
- <Path to test file> Full path and name of the test file to be used.
- <Number of threads (per test file)>
- <Mask > Set to 0x0
- <Size of test file in MB> Ideally, this should be large enough so that the test file will be larger than any cache resident on the SAN (or RAID controller).
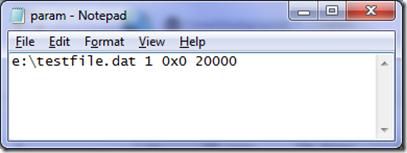
Of these 4 parameters, only the first one (the location of the file) and last one (the size of the file) matters for now. Below is a sample param.txt that tests a 20GB file on the E:\ Drive.
The next step is to run a quick SQLIO using sequential writes to create the test file. We are going to use the command-line to do this (although someone has written a GUI for the tool). So open a command prompt, change to the installation directory for SQLIO and type the command below (we will save an detailed explanation of the parameters for later).
sqlio -kW -s10 -fsequential -o8 -b8 -LS -Fparam.txt timeout /T 10
This command will create the file and run a 10 second test. The output will look something like what I have pasted below:
sqlio v1.5.SG
using system counter for latency timings, 2241035 counts per second
parameter file used: param.txt
file e:\testfile.dat with 1 thread (0) using mask 0x0 (0)
1 thread writing for 10 secs to file e:\testfile.dat
using 8KB sequential IOs
enabling multiple I/Os per thread with 8 outstanding
size of file e:\testfile.dat needs to be: 20971520000 bytes
current file size: 104857600 bytes
need to expand by: 20866662400 bytes
expanding e:\testfile.dat …
SQLIO will stop here for a while, while your PC chugs away creating the 20GB test file. Once completed, it will run out quick 10 second test, but you can ignore the rest of the output because this test is of no consequence.
Running a real test
The previous command was just the entre. We are not interested in the resulting data because the point of the exercise was to create the test file. Now it is time for the main course. Try this command. It will spend 2 minutes running a random IO write to the 20gig test file using a size of 8KB for each write.
sqlio -kW -b8 -frandom -s120 -BH -LS -Fparam.txt
Below is the output that summarises the configuration specified by the above command:
sqlio v1.5.SG
using system counter for latency timings, 2241035 counts per second
1 thread writing for 120 secs to file e:\TestFile.dat
using 8KB random IOs
buffering set to use hardware disk cache (but not file cache)
using current size: 20000 MB for file: e:\TestFile.dat
initialization done
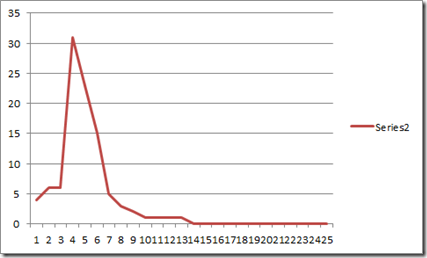
For the next two minutes SQLIO will chug away, hammering the disk with writes. Once the test has been performed, SQLIO will report its findings. You will see IOPS, MBPS and a report of average/max/min latency. On top of this, a histogram showing the distribution of latency is provided. This histogram gives context to the “average latency” figure because it shows the shape of the latency that occurred throughout the test. I graphed the distribution in excel below the SQLIO results below:
CUMULATIVE DATA:
throughput metrics:
IOs/sec: 225.80
MBs/sec: 1.76
latency metrics:
Min_Latency(ms): 0
Avg_Latency(ms): 3
Max_Latency(ms): 111
histogram:
ms: 0 1 2 3 4 5 6 7 8 9 10 11 12 13 14 15 16 17 18 19 20 21 22 23 24+
%: 4 6 6 31 23 15 5 3 2 1 1 1 1 0 0 0 0 0 0 0 0 0 0 0 0
Running the numbers…
Now, before we get into a more detailed test, let’s examine some of the SQLIO parameters:
- -k specifies whether to perform a read or write test (–kW for write and –kR for read)
- -s specifies how long to run the test for. In the example above it ran for 2 minutes (120 seconds)
- -f specifies whether to run a random or sequential IO operation (-frandom)
- -b specifies the size of the IO operations (in the example above 8KB)
- -t specifies the number of threads to use. A multi-cpu server should be able to utilise more threads than you have processors. If your storage can handle it, we can increase the number of threads and see what latency arises as a result.
- -o specifies the number of outstanding requests. This simulates a sudden spike in load and gives an indication of how fast IO requests are being serviced. If you keep adding outstanding requests, latency will start to increase as the number of IO requests outstrips the disks ability to service them.
- -LS means to capture the disk latency information. If you do not specify this you will not get any latency results
Okay, so how about we see what difference a queue of IO requests makes. Below is a SQLIO command with the addition of the –o parameter. Let’s see what a queue of 4 outstanding requests does and compare the historgram output…
sqlio -kW -b8 -frandom –s120 –o4 -BH -LS -Fparam.txt
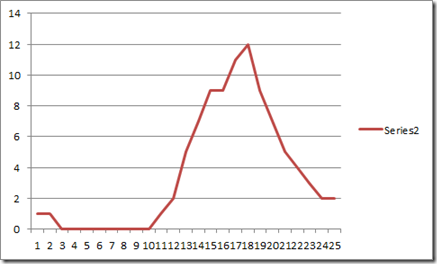
And the result? Much more latency than our first example above but no real increase in IOPS or MBPS. Clearly we are already at the limit of what my laptop can handle (I stripped the hyperbole and pasted the counters only).
IOs/sec: 221.73
MBs/sec: 1.73
Min_Latency(ms): 0
Avg_Latency(ms): 17
Max_Latency(ms): 187
Now since I only changed 1 parameter and such a difference was seen, most people will use SQLIO with a batch file to test different parameters. For example, if you were to paste the commands below into a batch file, you would be running write tests using 16KB, 32KB and 64KB sizes.
sqlio -kW -b16 -frandom -s120 -BH -LS -Fparam.txt
sqlio -kW -b64 -frandom -s120 -BH -LS -Fparam.txt
sqlio -kW -b128 -frandom -s120 -BH -LS -Fparam.txt
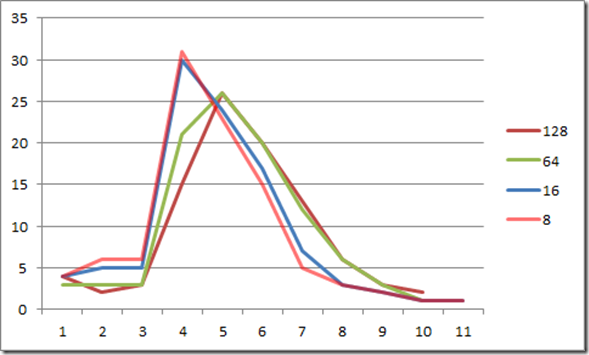
For what it’s worth, here is the results for each of the above tests (including the 8KB one we stared with) showing the relationship of IOPS, MBPS and latency. As predicted by our exploration of the relationship between request size, IOPS and MBPS in part 6, latency was smallest with the 8KB option.
| 8KB write | 16KB write | 64KB write | 128KB write |
| IOs/sec: 225.80
MBs/sec: 1.76 Avg_Latency(ms): 3 |
IOs/sec: 220.39
MBs/sec: 3.44 Avg_Latency(ms): 4 |
IOs/sec: 192.85
MBs/sec: 12.05 Avg_Latency(ms): 4 |
IO/Sec: 176.30
MB/sec: 22.02 Avg Latency(ms): 5 |
Now one quick note: If you want to play with the –t parameter and add more threads, you will have to reference the test file directly and not refer to the parameters file. This is because the one of the settings in the param.txt file is the number of threads for each file. Not matter what you put in at the command line, it will be overwritten by what is specified in param.txt. Thus the command below would only run a single thread despite 8 threads being specified via the –t parameter.
sqlio -kW -b64 -frandom -s120 -t8 -o1 -BH -LS -Fparam.txt
sqlio v1.5.SG
using system counter for latency timings, 2241035 counts per second
parameter file used: param.txt
file c:\testfile.dat with 1 thread (0) using mask 0x0 (0)
To get around this issue, drop the –F parameter and refer to the test file directly as shown below:
sqlio -kW -b64 -frandom -s120 -t8 -o1 -BH -LS e:\testfile.dat
sqlio v1.5.SG
using system counter for latency timings, 2241035 counts per second
8 threads writing for 120 secs to file e:\testfile.dat
Conclusion (and coming up next)…
Phew! Okay, so apart from possibly whetting your appetite for smashing disk infrastructure, you might have also come to the realisation that there are many parameters to test in various combinations. In this entire article, I have assumed random writes to the disk, but what about sequential writes? For that matter, what about reads? What about multiple threads and more outstanding requests? What about longer tests or different sized test files?
These are all important questions and I will answer them… in the next post or two. This one is getting a little too long and I have plenty more to cover in this area.
So have a play with the parameters on SQLIO on your own hardware and in the next post, we will continue looking at SQLIO, plus some great work people have done to make your life much easier using it. I want to also return to PERFMON to show you the relationship between the PhysicalDisk and LogicalDisk counters and what SQLIO reports. Then we will examine two other tools, including one that is lesser known, but a very powerful way to measure disk performance. (That one will redeem me with the tech guys who will have no doubt found this article to be too light on 🙂
Subsequent to that, we hark way back to part 1 and return to a lead indicator point of view of disk IO performance and look at how you can nail the ass off your SAN vendor to ensure they do all the due diligence necessary that your Disk infrastructure will perform well.
Until then, thanks for reading
Paul Culmsee


0 Comments on “Demystifying SharePoint Performance Management Part 7 – Getting at Latency, IOPS and MBPS”